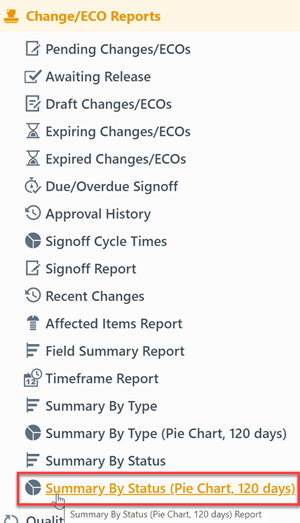
Summary By Status(Pie Chart,120 days)
Summary By Status(Pie Chart,120 days)
Overview
The Summary By Status(Pie Chart,120 Days) Report provides various reports on specific fields assigned to Change/ECOs or Quality/CAPA items.
To view the Summary By Status(Pie Chart,120 Days) report, select the Summary By Status(Pie Chart, 120 Days) Report link from the object specific section of the Home Page.
Report Basics
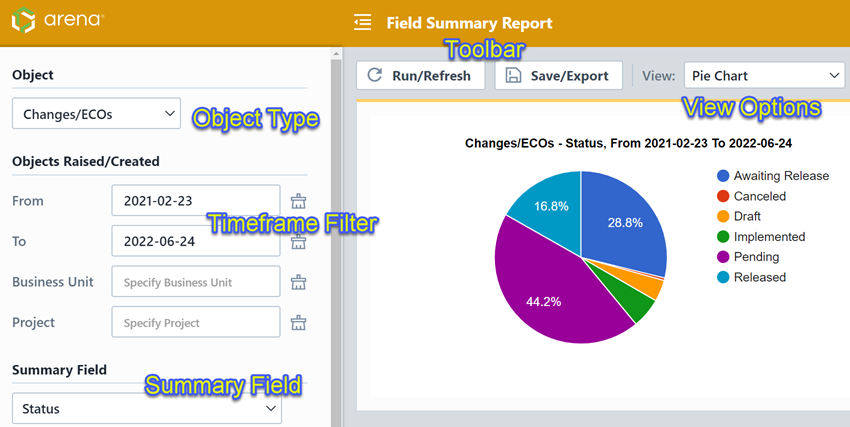
The Summary By Status(Pie Chart,120 Days) Report contains the following key areas:
Report Options
The report contains an Options pane that allows you to select which objects and fields to include in the report. You can display and hide the Options pane by selecting the Options/Menu button.
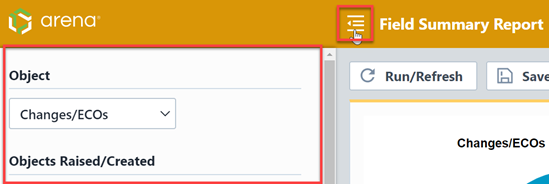
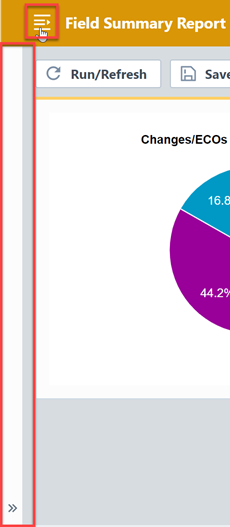
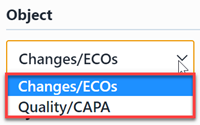
The Options pane allows you to select the report objects (Changes/ECOs or Quality/CAPA).
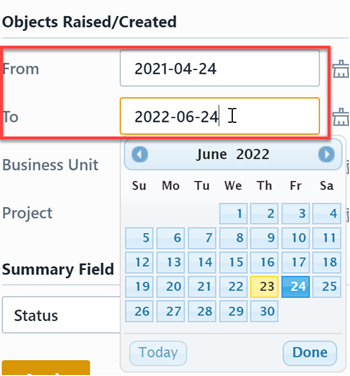
You can filter the report by the timeframe the objects were created by setting the Objects Raised/Created fields.
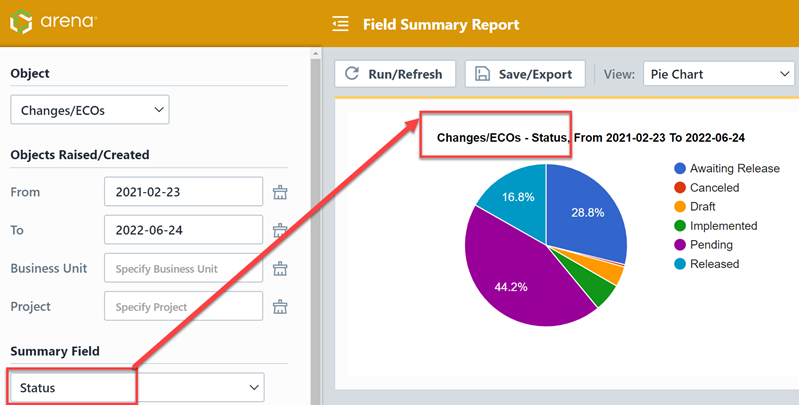
You can change the field from the Summary Field drop list.
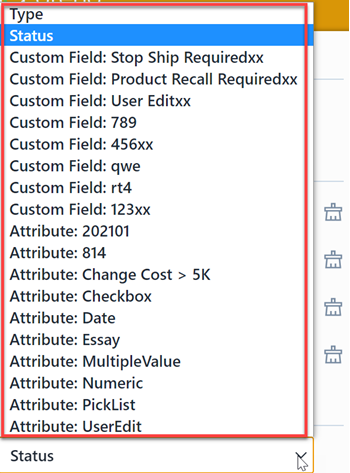
You will be able to select general fields (such as Type and Status) as well as Attributes and Custom fields.
Report Results
The report summary/counts will depend on the field selected in the Summary Field drop list. As the current report is Summary By Status(Pie Chart,120 Days) report, the default field will be Status.
Result Views
As the current report is Summary By Status(Pie Chart,120 Days), the default view option will be Pie Chart. And you can change the viewing modes from the drop list.
The report results view can be displayed as one of the following:

| View | Description |
|---|---|
| Results Table | Simple table that displays each unique value and occurrence count 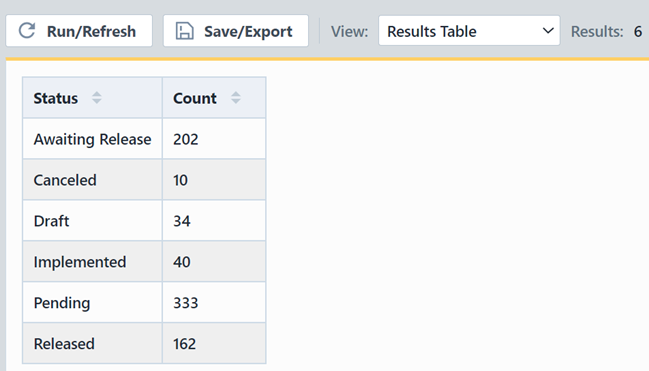 |
| HTML Bar Graph | Displays each unique value and occurrence count in a simple bar graph 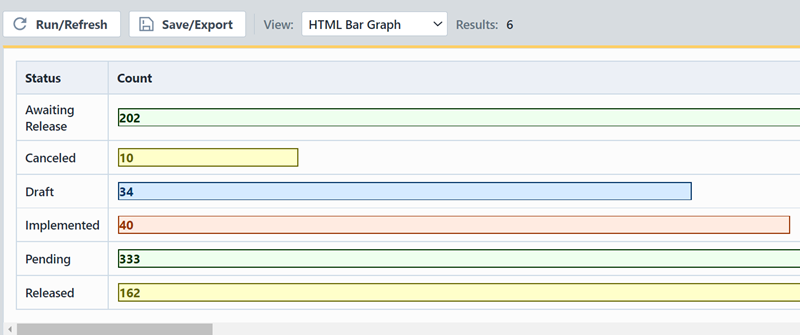 |
| Pie Chart | Displays each unique value and occurrence count as a pie chart 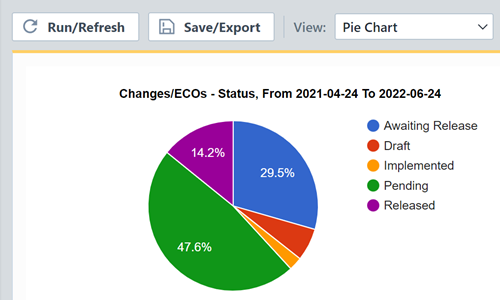 |
| Interactive Bar Graph | Displays each unique value and occurrence count as a bar graph that you can mouse over for details 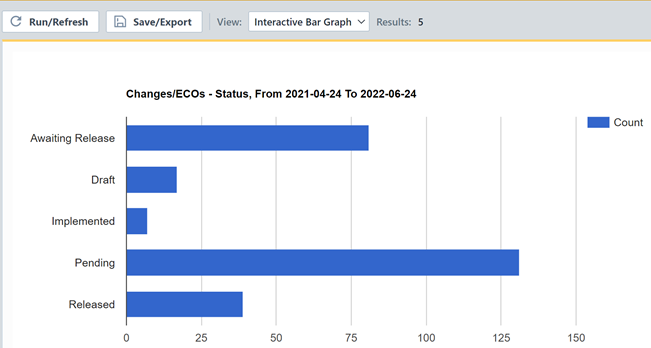 |
Results Export
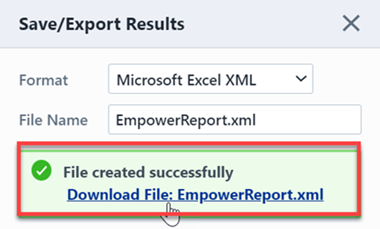
You can export the results by clicking the Save/Export toolbar button.

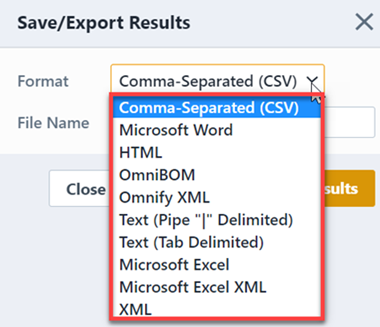
From the Export Report panel, you can select the output format and file name.
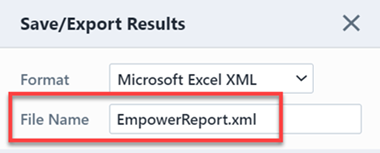
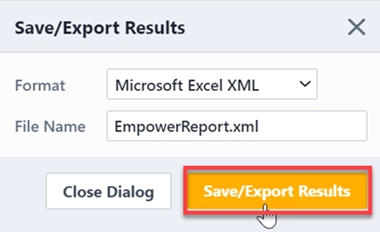
Once the format and file have been specified, click the Save/Export Results button to create the report.
If the file is created successfully, the download link will be available. To view the report, click the download link.
